Dashboard
Monitor deployments, analytics, and team activity
The Aperture dashboard provides a comprehensive overview of your web-to-native deployments, analytics, and team activity. This guide will help you understand the dashboard’s features and how to use them effectively to monitor and manage your deployments.
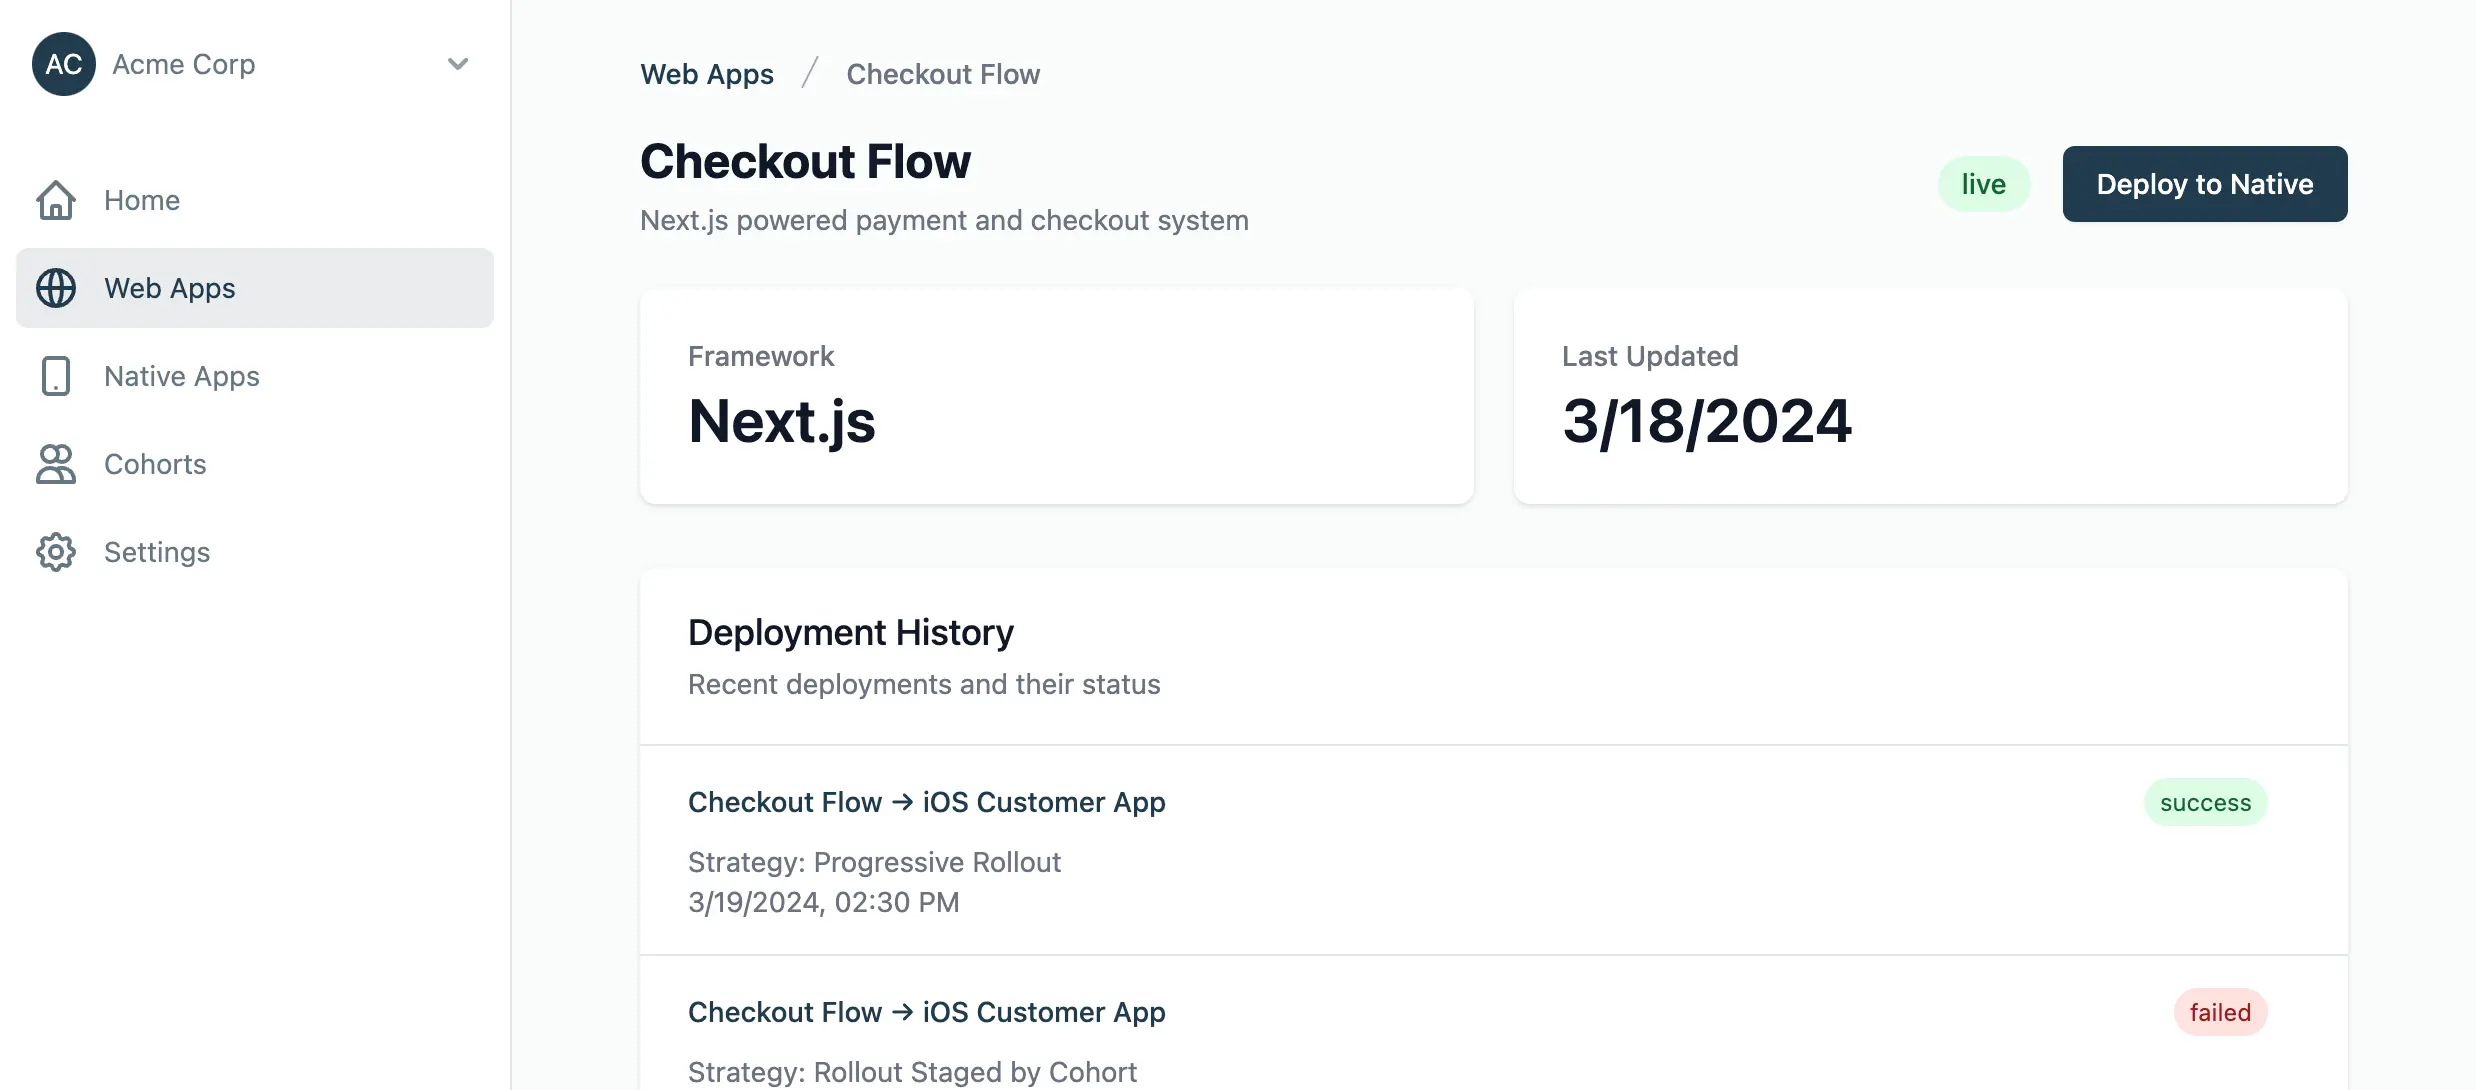
The Aperture dashboard with key areas highlighted
Dashboard Layout
The dashboard is organized into several key sections, each designed to give you quick access to important information about your deployments:
Overview Panel
The overview panel displays key metrics and statistics about your web and native applications. This includes active users, total deployments, recent activity, and performance indicators.
Applications Section
This section provides access to both your web applications and native applications, allowing you to manage the source and destination of your deployments. You can quickly view status, deployment history, and configuration details.
Deployments
Monitor active and past deployments, including their status, target audience, and rollout progress. This section provides detailed insights into how your updates are reaching users.
Analytics Dashboard
The analytics dashboard provides visualizations of your deployment data, including adoption rates, error rates, and performance metrics. You can track how quickly users are receiving and applying updates.
Team Activity
See recent actions by team members, allowing you to track collaboration and deployment activities. This section helps maintain accountability and visibility across your organization.
Deployment Monitoring
One of the most important features of the Aperture dashboard is the ability to monitor your deployments in real-time:
Deployment Timeline
Visualize the progression of your deployment through different phases, from initial rollout to complete adoption.
User Adoption
Track how many users have received and applied your updates.
Error Monitoring
Quickly identify and diagnose issues with your deployments, including JavaScript errors, network failures, and performance bottlenecks.
Deployment Strategies
From the dashboard, you can configure and monitor different deployment strategies:
Progressive Rollout
Gradually increase the percentage of users who receive an update, minimizing risk by monitoring for issues before affecting your entire user base.
Dashboard Features:
- Phase progression tracking
- User percentage visualization
- Error rate monitoring with automatic rollback triggers
Advanced Dashboard Features
Enterprise and Pro users can access these additional dashboard capabilities:
Deployment Scheduling
Plan and schedule deployments in advance, with automatic phase progression based on performance metrics.
Advanced Analytics
Access detailed deployment analytics including usage patterns, error correlation, and performance impact analysis.
Audit Logging
Comprehensive history of all deployment activities and configuration changes for compliance and troubleshooting.
Pro Tip: When monitoring a progressive rollout, pay special attention to error rates and performance metrics during the first phase. If these metrics remain stable, you can confidently proceed to the next phase. The dashboard provides visual indicators when it’s safe to proceed.